View the main page for election info at www.mysaline.com/elections-2020
Scroll down for the General Election Results for Saline County, Arkansas, sponsored by Exceptional Physical Therapy, 1102 W.South Street, Benton, AR 72015, 501-778-4224.
 Several sources have called races for U.S. Sen. Tom Cotton, U.S. Cong. French Hill and, for Arkansas only, Pres. Donald Trump. Also Ark. Sen. Alan Clark and Keith Brooks for Ark Rep. Long story short, Saline County is voting Republican in most races.
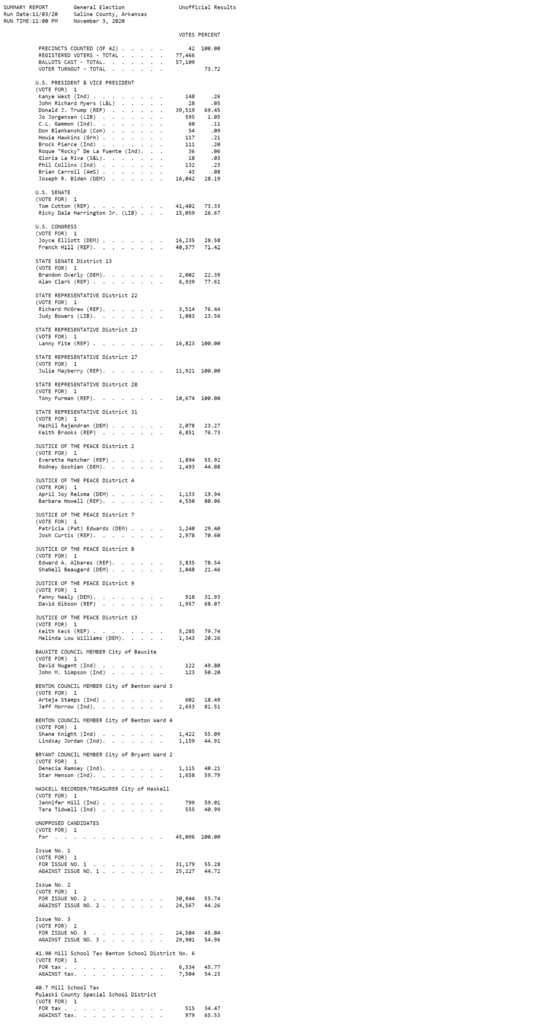
MOBILE USERS, CLICK THE IMAGE TO ENLARGE. DESKTOP/COMPUTER USERS CAN SCROLL TO TEXT VERSION.
SUMMARY REPORT        General Election                 Unofficial Results
Run Date:11/03/20     Saline County, Arkansas
RUN TIME:11:00 PM     November 3, 2020

                                                       VOTES PERCENT

           PRECINCTS COUNTED (OF 42) .  .  .  .  .        42  100.00
           REGISTERED VOTERS - TOTAL .  .  .  .  .    77,466
           BALLOTS CAST - TOTAL.  .  .  .  .  .  .    57,109
           VOTER TURNOUT - TOTAL  .  .  .  .  .  .             73.72

          U.S. PRESIDENT & VICE PRESIDENT
          (VOTE FOR)  1
           Kanye West (Ind) .  .  .  .  .  .  .  .       148     .26
           John Richard Myers (L&L)  .  .  .  .  .        28     .05
           Donald J. Trump (REP)  .  .  .  .  .  .    39,519   69.45
           Jo Jorgensen (LIB)  .  .  .  .  .  .  .       595    1.05
           C.L. Gammon (Ind).  .  .  .  .  .  .  .        60     .11
           Don Blankenship (Con)  .  .  .  .  .  .        54     .09
           Howie Hawkins (Grn) .  .  .  .  .  .  .       117     .21
           Brock Pierce (Ind)  .  .  .  .  .  .  .       111     .20
           Roque "Rocky" De La Fuente (Ind).  .  .        36     .06
           Gloria La Riva (S&L).  .  .  .  .  .  .        18     .03
           Phil Collins (Ind)  .  .  .  .  .  .  .       132     .23
           Brian Carroll (AmS) .  .  .  .  .  .  .        43     .08
           Joseph R. Biden (DEM)  .  .  .  .  .  .    16,042   28.19

          U.S. SENATE
          (VOTE FOR)  1
           Tom Cotton (REP) .  .  .  .  .  .  .  .    41,402   73.33
           Ricky Dale Harrington Jr. (LIB) .  .  .    15,059   26.67

          U.S. CONGRESS
          (VOTE FOR)  1
           Joyce Elliott (DEM) .  .  .  .  .  .  .    16,235   28.58
           French Hill (REP).  .  .  .  .  .  .  .    40,577   71.42

          STATE SENATE District 13
          (VOTE FOR)  1
           Brandon Overly (DEM).  .  .  .  .  .  .     2,002   22.39
           Alan Clark (REP) .  .  .  .  .  .  .  .     6,939   77.61

          STATE REPRESENTATIVE District 22
          (VOTE FOR)  1
           Richard McGrew (REP).  .  .  .  .  .  .     3,514   76.44
           Judy Bowers (LIB).  .  .  .  .  .  .  .     1,083   23.56

          STATE REPRESENTATIVE District 23
          (VOTE FOR)  1
           Lanny Fite (REP) .  .  .  .  .  .  .  .    16,823  100.00

          STATE REPRESENTATIVE District 27
          (VOTE FOR)  1
           Julie Mayberry (REP).  .  .  .  .  .  .    11,921  100.00

          STATE REPRESENTATIVE District 28
          (VOTE FOR)  1
           Tony Furman (REP).  .  .  .  .  .  .  .    10,674  100.00

          STATE REPRESENTATIVE District 31
          (VOTE FOR)  1
           Mazhil Rajendran (DEM) .  .  .  .  .  .     2,078   23.27
           Keith Brooks (REP)  .  .  .  .  .  .  .     6,851   76.73

          JUSTICE OF THE PEACE District 2
          (VOTE FOR)  1
           Everette Hatcher (REP) .  .  .  .  .  .     1,894   55.92
           Rodney Goshien (DEM).  .  .  .  .  .  .     1,493   44.08

          JUSTICE OF THE PEACE District 4
          (VOTE FOR)  1
           April Joy Reisma (DEM) .  .  .  .  .  .     1,133   19.94
           Barbara Howell (REP).  .  .  .  .  .  .     4,550   80.06

          JUSTICE OF THE PEACE District 7
          (VOTE FOR)  1
           Patricia (Pat) Edwards (DEM) .  .  .  .     1,240   29.40
           Josh Curtis (REP).  .  .  .  .  .  .  .     2,978   70.60

          JUSTICE OF THE PEACE District 8
          (VOTE FOR)  1
           Edward A. Albares (REP).  .  .  .  .  .     3,835   78.54
           ShaNell Beaugard (DEM) .  .  .  .  .  .     1,048   21.46

          JUSTICE OF THE PEACE District 9
          (VOTE FOR)  1
           Fanny Neely (DEM).  .  .  .  .  .  .  .       918   31.93
           David Gibson (REP)  .  .  .  .  .  .  .     1,957   68.07

          JUSTICE OF THE PEACE District 13
          (VOTE FOR)  1
           Keith Keck (REP) .  .  .  .  .  .  .  .     5,285   79.74
           Melinda Lou Williams (DEM).  .  .  .  .     1,343   20.26

          BAUXITE COUNCIL MEMBER City of Bauxite
          (VOTE FOR)  1
           David Nugent (Ind)  .  .  .  .  .  .  .       122   49.80
           John M. Simpson (Ind)  .  .  .  .  .  .       123   50.20

          BENTON COUNCIL MEMBER City of Benton Ward 3
          (VOTE FOR)  1
           Arteja Stamps (Ind) .  .  .  .  .  .  .       602   18.49
           Jeff Morrow (Ind).  .  .  .  .  .  .  .     2,653   81.51

          BENTON COUNCIL MEMBER City of Benton Ward 4
          (VOTE FOR)  1
           Shane Knight (Ind)  .  .  .  .  .  .  .     1,422   55.09
           Lindsay Jordan (Ind).  .  .  .  .  .  .     1,159   44.91

          BRYANT COUNCIL MEMBER City of Bryant Ward 2
          (VOTE FOR)  1
           Denecia Ramsey (Ind).  .  .  .  .  .  .     1,115   40.21
           Star Henson (Ind).  .  .  .  .  .  .  .     1,658   59.79

          HASKELL RECORDER/TREASURER City of Haskell
          (VOTE FOR)  1
           Jennifer Hill (Ind) .  .  .  .  .  .  .       799   59.01
           Tara Tidwell (Ind)  .  .  .  .  .  .  .       555   40.99

          UNOPPOSED CANDIDATES
          (VOTE FOR)  1
           For  .  .  .  .  .  .  .  .  .  .  .  .    45,096  100.00

          Issue No. 1
          (VOTE FOR)  1
           FOR ISSUE NO. 1  .  .  .  .  .  .  .  .    31,179   55.28
           AGAINST ISSUE NO. 1 .  .  .  .  .  .  .    25,227   44.72

          Issue No. 2
          (VOTE FOR)  1
           FOR ISSUE NO. 2  .  .  .  .  .  .  .  .    30,944   55.74
           AGAINST ISSUE NO. 2 .  .  .  .  .  .  .    24,567   44.26

          Issue No. 3
          (VOTE FOR)  1
           FOR ISSUE NO. 3  .  .  .  .  .  .  .  .    24,504   45.04
           AGAINST ISSUE NO. 3 .  .  .  .  .  .  .    29,901   54.96

          41.90 Mill School Tax Benton School District No. 6
          (VOTE FOR)  1
           FOR tax .  .  .  .  .  .  .  .  .  .  .     6,334   45.77
           AGAINST tax.  .  .  .  .  .  .  .  .  .     7,504   54.23

          40.7 Mill School Tax
          Pulaski County Special School District
          (VOTE FOR)  1
           FOR tax .  .  .  .  .  .  .  .  .  .  .       515   34.47
           AGAINST tax.  .  .  .  .  .  .  .  .  .       979   65.53
Keep watching here, and you can share this link with friends: https://www.mysaline.com/2020-results/
GENERAL ELECTION UPDATE 11pm, Nov 2, 2020
See Early Voting Results for General Election 2020… https://www.mysaline.com/2020-early-voting/
PRIMARY ELECTION UPDATE 11am March 4, 2020
State Representative Candidate Calls for Vote Recount Due to Close Race… www.mysaline.com/hawk-brooks-recount/
PRIMARY ELECTION UPDATE 7am March 4, 2020
House Race Flipped; Undervotes Explained
ANALYZING THE RESULTS
We looked at Saline County votes on election night, but a two-county total flipped the winner in a local legislative race.
See results below from the 2020 Primary, Judicial and School Elections. But if you’ve already seen it, let’s talk about the number of people who voted, some races that were very close, and the existence of something called an undervote.
LOW VOTER TURNOUT
First off, let’s look at the percentage of voters who showed up to do their civic duty. According to the Saline County Clerk’s files, there are currently 73,593 registered voters. In this election, 23,290 of those voters submitted a ballot. That’s only 31.65% of our voters who came to vote. I realize many voters may have a difficult time getting out there to make it official. Some might have been sick, or maybe working, or had some other thing good on. I get that. But did 68.35% have those issues for two weeks of early voting? Even on Saturdays? I submit that voter apathy played a large part in this abysmal outcome. Next topic.
RACE FLIPPED WITH TWO-COUNTY TOTAL
The night of Super Tuesday, MySaline reported all the voting numbers from Saline County; however, some races span more than one county, so you can’t base the outcome on Saline County numbers alone.
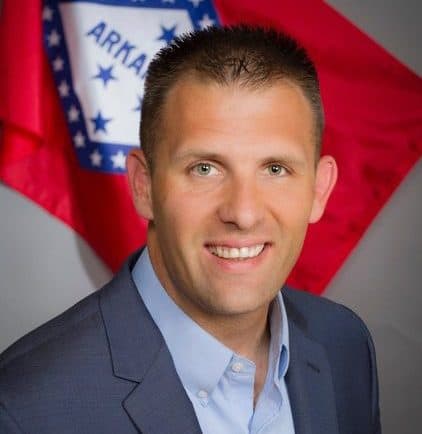
In particular, the race for State House of Representatives in District 31 had Keith Brooks (above, left) and RJ Hawk (above, right) as opponents. It was a very close race, and if you look at the Saline County numbers, they show Hawk in the lead by 47 votes. But the District runs into Pulaski County as well, so you have to add in those numbers.
State Rep Dist 31 – Saline County Votes
- Keith Brooks – 1,147 – 49.00%
- RJ Hawk – 1,194 – 51.00%
- Under Votes – 59
With Brooks picking up another 940 votes in Pulaski County, and Hawk getting another 866 votes there, the totals changed.
State Rep Dist 31 – Pulaski County Votes
- Keith Brooks – 940 – 52.05%
- RJ Hawk – 866- 49.95%
- Under Votes – 160
So the final (unofficial) count puts Brooks in the lead with a two-county total of 2,087 votes, while Hawk received 2,060 votes, a difference of only 27 votes.
State Representative District 31 – Both Counties Votes
- Keith Brooks – 2,087- 50.32%
- RJ Hawk – 2,060- 49.67%
- Under Votes – 219
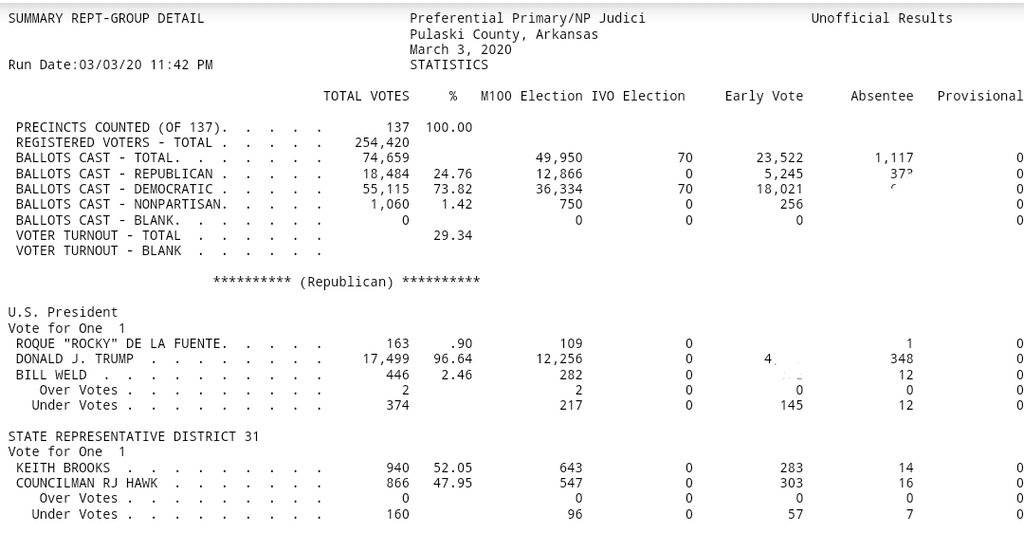
(Above) The Pulaski County Preferential Primary Results combined with the Saline County numbers farther down this page, shows Keith Brooks as the winner in State Representative District 31 race. (Click image to enlarge)
UNDER VOTES EXPLAINED
Every race was very important for obvious reasons, but the close numbers from the above state representative race and these two judge races below illustrate the importance of showing up to vote, and also… voting when you show up. An under vote is when a voter goes to the poll, gets a ballot, but doesn’t vote in one or more races. Furthermore, an over vote is when they vote for more than one candidate or choice in any given race. The advancement of electronic voting equipment has made those numbers nil, so it’s a moot statistic anymore, but it’s still included in the report. Many qualified voters in these races had their ballot but chose not to vote – enough that if they did vote, there was a real possibility of changing the outcome.
The first race below shows a difference of 739 votes, but with 1,201 under votes.
Circuit Judge Dist. 22, Div. 3
- Brent Houston – 11,414 – 51.67%
- Josh Newton – 10,675 – 48.33%
- Under Votes – 1,201
This second race shows a difference of 966 votes, but with 1,506 under votes.
State District Court Dist. 32, Div. 1
- Clay Ford – 11,375 – 52.22%
- Brent Standridge – 10,409 – 47.78%
- Under Votes – 1,506
So why are people showing up to vote – and then not voting? This writer’s theory is that those voters simply haven’t made up their mind for those races. But looking in previous elections, there can be a deeper reason than mere undecidedness.
Let’s pretend for example that you are school employee and there is a school millage ballot issue that’s in a special election. There would be only one thing on the ballot. If you’re undecided, it seems like an easy choice to just stay home and not vote. However that’s not likely the choice you’ll make if you know your employer can go to public records and see whether you voted at all.
How an individual voted (yay or nay) is not part of publicly accessible record, but the public can see if an individual voted. And if it’s a partisan race like our recent primary was, they can see if you chose a Republican or Democratic ticket.
So what if the millage fails by a few votes and your employer is looking later at the record of who voted? Typically, you (remember, we’re pretending you’re a school employee) would want to be on the list of people who voted, so the employer wouldn’t perhaps think your lack of voting is part of the reason the millage failed.
The short version of that is that some people under vote because they are undecided but want the public record to show they voted (because of employers, friends or family possibly looking at the record).
SALINE COUNTY ELECTION RESULTS (ONLY SALINE COUNTY)
UPDATE 9:47PM ALL VOTING CENTERS/PRECINCTS REPORTING If you're on a mobile device, click images below to enlarge. If you're on a desktop view, you can read the text version.SUMMARY REPT-GROUP DETAIL Preferential Primary UNOFFICIAL RESULTS Saline County, Arkansas March 3, 2020 Run Date:03/03/20 09:47 PM STATISTICS TOTAL VOTES % Early Ele Day Absentee PRECINCTS COUNTED (OF 42) . . . . . 42 100.00 REGISTERED VOTERS - TOTAL . . . . . 73,593 BALLOTS CAST - TOTAL. . . . . . . 23,290 11,370 11,742 178 BALLOTS CAST - Republican . . . . . 14,601 62.69 7,304 7,197 100 BALLOTS CAST - Democratic . . . . . 8,413 36.12 3,919 4,423 71 BALLOTS CAST - NONPARTISAN. . . . . 276 1.19 147 122 7 VOTER TURNOUT - TOTAL . . . . . . 31.65 ********** (Republican) ********** U.S. PRESIDENT (VOTE FOR) 1 Bill Weld . . . . . . . . . . 296 2.05 165 128 3 Roque "Rocky" De La Fuente. . . . . 107 .74 57 50 0 Donald J. Trump . . . . . . . . 14,040 97.21 6,999 6,945 96 Over Votes . . . . . . . . . 0 0 0 0 Under Votes . . . . . . . . . 158 83 74 1 STATE SENATE District 13 (VOTE FOR) 1 Senator Alan Clark . . . . . . . 1,891 78.50 853 1,024 14 Jeff Crow . . . . . . . . . . 518 21.50 245 273 0 Over Votes . . . . . . . . . 0 0 0 0 Under Votes . . . . . . . . . 52 18 33 1 STATE REPRESENTATIVE District 22 (VOTE FOR) 1 Jack Wells . . . . . . . . . . 502 35.23 278 208 16 Richard Alvin Midkiff . . . . . . 114 8.00 57 57 0 Richard McGrew. . . . . . . . . 809 56.77 460 332 17 Over Votes . . . . . . . . . 0 0 0 0 Under Votes . . . . . . . . . 45 17 27 1 STATE REPRESENTATIVE District 28 (VOTE FOR) 1 Marietta McClure . . . . . . . . 1,196 39.25 617 571 8 Tony Furman. . . . . . . . . . 1,851 60.75 998 839 14 Over Votes . . . . . . . . . 0 0 0 0 Under Votes . . . . . . . . . 49 20 29 0 STATE REPRESENTATIVE District 31 (VOTE FOR) 1 RJ Hawk . . . . . . . . . . . 1,194 51.00 514 679 1 Keith Brooks . . . . . . . . . 1,147 49.00 514 627 6 Over Votes . . . . . . . . . 0 0 0 0 Under Votes . . . . . . . . . 59 17 42 0 ********** (Democratic) ********** U.S. PRESIDENT (VOTE FOR) 1 Bernie Sanders. . . . . . . . . 1,816 21.70 707 1,103 6 Steve Bullock . . . . . . . . . 2 .02 1 1 0 Joe Sestak . . . . . . . . . . 10 .12 6 4 0 Michael R. Bloomberg. . . . . . . 1,531 18.30 925 594 12 Mosie Boyd . . . . . . . . . . 6 .07 5 1 0 Cory Booker. . . . . . . . . . 14 .17 6 8 0 Pete Buttigieg. . . . . . . . . 399 4.77 383 12 4 Amy Klobuchar . . . . . . . . . 385 4.60 347 31 7 Michael Bennet. . . . . . . . . 9 .11 5 4 0 Elizabeth Warren . . . . . . . . 834 9.97 357 464 13 Joseph R. Biden . . . . . . . . 3,122 37.31 1,039 2,059 24 John K. Delaney . . . . . . . . 8 .10 6 2 0 Kamala Harris . . . . . . . . . 45 .54 17 27 1 Marianne Williamson . . . . . . . 17 .20 8 9 0 Andrew Yang. . . . . . . . . . 22 .26 8 14 0 Julian Castro . . . . . . . . . 13 .16 1 12 0 Tom Steyer . . . . . . . . . . 96 1.15 65 30 1 Tulsi Gabbard . . . . . . . . . 39 .47 13 25 1 Over Votes . . . . . . . . . 1 0 0 1 Under Votes . . . . . . . . . 44 20 23 1 ********** (NONPARTISAN) ********** STATE SUPREME COURT Associate Justice, Pos.4 (VOTE FOR) 1 Morgan "Chip" Welch . . . . . . . 10,591 47.11 5,333 5,173 85 Barbara Womack Webb . . . . . . . 11,890 52.89 5,658 6,154 78 Over Votes . . . . . . . . . 0 0 0 0 Under Votes . . . . . . . . . 809 379 415 15 CIRCUIT JUDGE Dist. 22, Div. 2 (VOTE FOR) 1 Bobby Digby. . . . . . . . . . 6,976 31.39 3,489 3,439 48 Josh Farmer. . . . . . . . . . 15,247 68.61 7,405 7,734 108 Over Votes . . . . . . . . . 0 0 0 0 Under Votes . . . . . . . . . 1,067 476 569 22 CIRCUIT JUDGE Dist. 22, Div. 3 (VOTE FOR) 1 Brent Houston . . . . . . . . . 11,414 51.67 5,730 5,588 96 Josh Newton. . . . . . . . . . 10,675 48.33 5,106 5,509 60 Over Votes . . . . . . . . . 0 0 0 0 Under Votes . . . . . . . . . 1,201 534 645 22 STATE DISTRICT COURT Dist. 32, Div. 1 (VOTE FOR) 1 Clay Ford . . . . . . . . . . 11,375 52.22 5,732 5,567 76 Brent Standridge . . . . . . . . 10,409 47.78 4,974 5,360 75 Over Votes . . . . . . . . . 0 0 0 0 Under Votes . . . . . . . . . 1,506 664 815 27 BOARD OF DIRECTORS Glen Rose School District No. 3 (VOTE FOR) 1 Audrey Spence-Raper . . . . . . . 124 27.43 23 101 0 Michael Wingfield. . . . . . . . 200 44.25 60 140 0 Daniel Jones . . . . . . . . . 73 16.15 23 50 0 Wade Stafford . . . . . . . . . 55 12.17 18 37 0 Over Votes . . . . . . . . . 0 0 0 0 Under Votes . . . . . . . . . 19 2 16 1 BOARD OF DIRECTORS Sheridan School District No. 37 (VOTE FOR) 1 Jan Caldwell . . . . . . . . . 824 54.50 337 483 4 James "Gart" Pitts . . . . . . . 688 45.50 344 343 1 Over Votes . . . . . . . . . 0 0 0 0 Under Votes . . . . . . . . . 101 50 49 2 STATE REPRESENTATIVE District 22 (VOTE FOR) 1 Judy Bowers. . . . . . . . . . 652 30.73 339 295 18 Richard McGrew. . . . . . . . . 1,470 69.27 820 627 23 Over Votes . . . . . . . . . 0 0 0 0 Under Votes . . . . . . . . . 122 61 57 4 38.6 Total Mills School Tax Bauxite School District No. 14 (VOTE FOR) 1 FOR Tax . . . . . . . . . . . 514 50.84 227 286 1 AGAINST Tax. . . . . . . . . . 497 49.16 197 298 2 Over Votes . . . . . . . . . 0 0 0 0 Under Votes . . . . . . . . . 5 2 3 0 40.8 Mill School Tax Bryant School District No. 25 (VOTE FOR) 1 For Tax . . . . . . . . . . . 4,390 46.27 1,989 2,360 41 Against Tax. . . . . . . . . . 5,097 53.73 2,172 2,899 26 Over Votes . . . . . . . . . 0 0 0 0 Under Votes . . . . . . . . . 100 39 60 1 34.8 Mill School Tax Fountain Lake School District No. 18 (VOTE FOR) 1 For Tax . . . . . . . . . . . 1,517 53.32 884 601 32 Against Tax. . . . . . . . . . 1,328 46.68 817 497 14 Over Votes . . . . . . . . . 0 0 0 0 Under Votes . . . . . . . . . 36 23 12 1 38.2 Mill School Tax Glen Rose School District No. 3 (VOTE FOR) 1 FOR tax . . . . . . . . . . . 263 56.32 71 192 0 AGAINST tax. . . . . . . . . . 204 43.68 54 149 1 Over Votes . . . . . . . . . 0 0 0 0 Under Votes . . . . . . . . . 4 1 3 0 38.7 Mill School Tax Jessieville School District No. 17 (VOTE FOR) 1 For Tax . . . . . . . . . . . 20 55.56 12 8 0 Against Tax. . . . . . . . . . 16 44.44 10 6 0 Over Votes . . . . . . . . . 0 0 0 0 Under Votes . . . . . . . . . 0 0 0 0 36.0 Mill School Tax Sheridan School District No. 37 (VOTE FOR) 1 FOR tax . . . . . . . . . . . 764 47.99 357 403 4 AGAINST tax. . . . . . . . . . 828 52.01 367 458 3 Over Votes . . . . . . . . . 0 0 0 0 Under Votes . . . . . . . . . 21 7 14 0
The address for this page is
mysaline.com/2020-results.
- Early Voting Results for March Primary Election 2020
- Click here for results in Special Election District 22
Return to the main page for 2020 elections: https://www.mysaline.com/elections-2020/

